

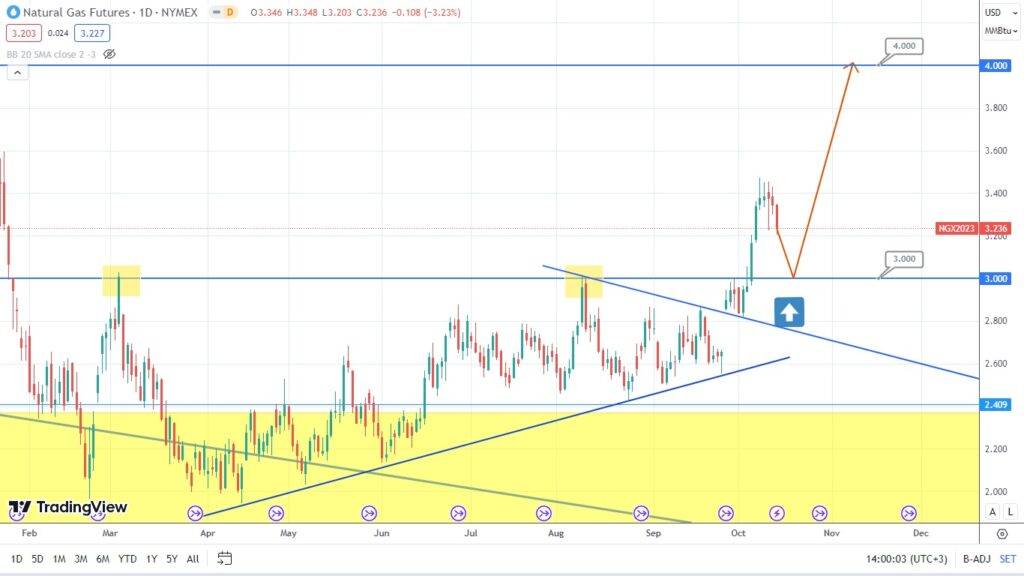
The price of natural gas broke a very strong and important psychological level of 3.00. Currently, the asset is rebounding to the broken horizontal trendline. The price of gas is likely to test the broken level of 3.00, rise, and target the level of 4.00 next. So, let’s observe whether it is going to happen.
Bitcoin is gradually rebounding and getting back to its broken downtrend. The asset’s price might potentially rebound from this downtrend and jump. It’s noteworthy that the asset may test the supporting level of 25000 first. After that, Bitcoin bulls may seize the initiative and help the asset rise.
The NASDAQ composite index rebounded from the downtrend and formed a descending triangle. This pattern may either signify the continuation of the current trend or be a sign of an upcoming reversal. Should the index break the resistance level of 14557, bears will step in. If the index rebounds from this level, it might rise and break the upper side of the descending triangle. In this case, it would be important to follow the candlestick formations and spot potential false breakouts.
Source: Tickmill