

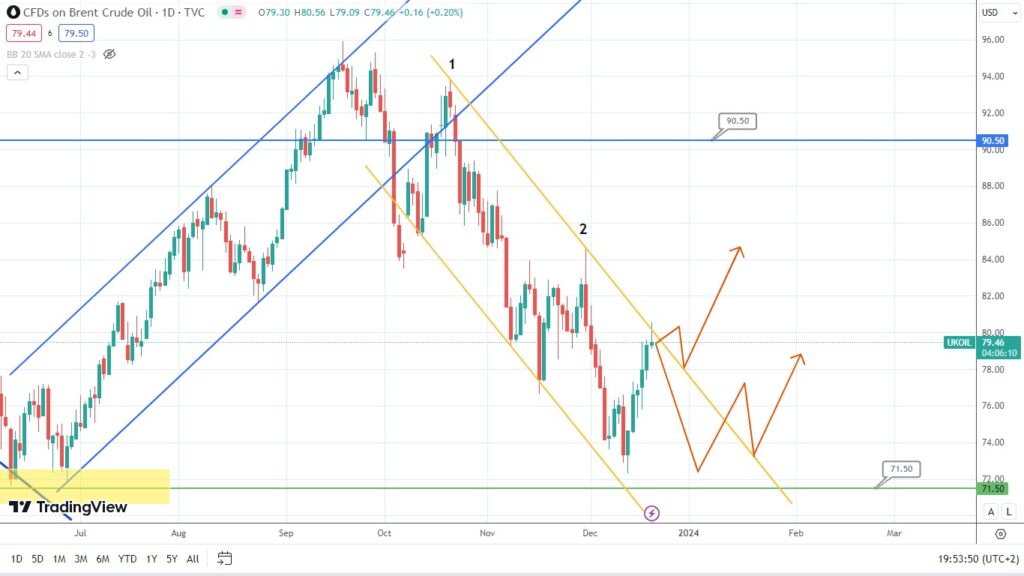
Brent oil is testing the upper boundary of the downtrend, trying to form a shooting star. The price of this asset might either rebound from the downtrend and gain the required support at the level of 71.50 or break the downtrend and rise. So, let’s observe which scenario is going to work out.
The daily chart of the ETH/USD pair shows signs of the potential formation of a bullish flag. This pattern usually signifies the continuation of the current trend. The flag rests against the supporting level of 2135, indicating that the asset’s price might rise soon.
The price of the Canadian dollar is heading down and gradually approaching the downtrend and supporting level of 1.3150. The asset’s price might potentially get the required support, rebound, and jump. Hence, it would be very important to follow the candlestick formations to forecast the upcoming price movements.
Source: Tickmill